01
EMPATHY
The goal is to understand user habits, needs, and pain points by putting ourselves in the user’s shoes. I tried to gather as much data as I could.
Quantitative Research
Obtained quantitative data from trusted organizations.
- National Renewable Energy Laboratory
- The Brattle Group
- EY-Eurelectric
- European Electric Vehicle Charging Infrastructure Master Plan
- EY-Eurelectric
- Volvo
- Freewire White Paper, Driving EV Adoption, April 2022
- Ergon Energy Network and Energex White Paper
- Sabanci University, Türkiye Elektrikli Araçlar Görünümü report 2021
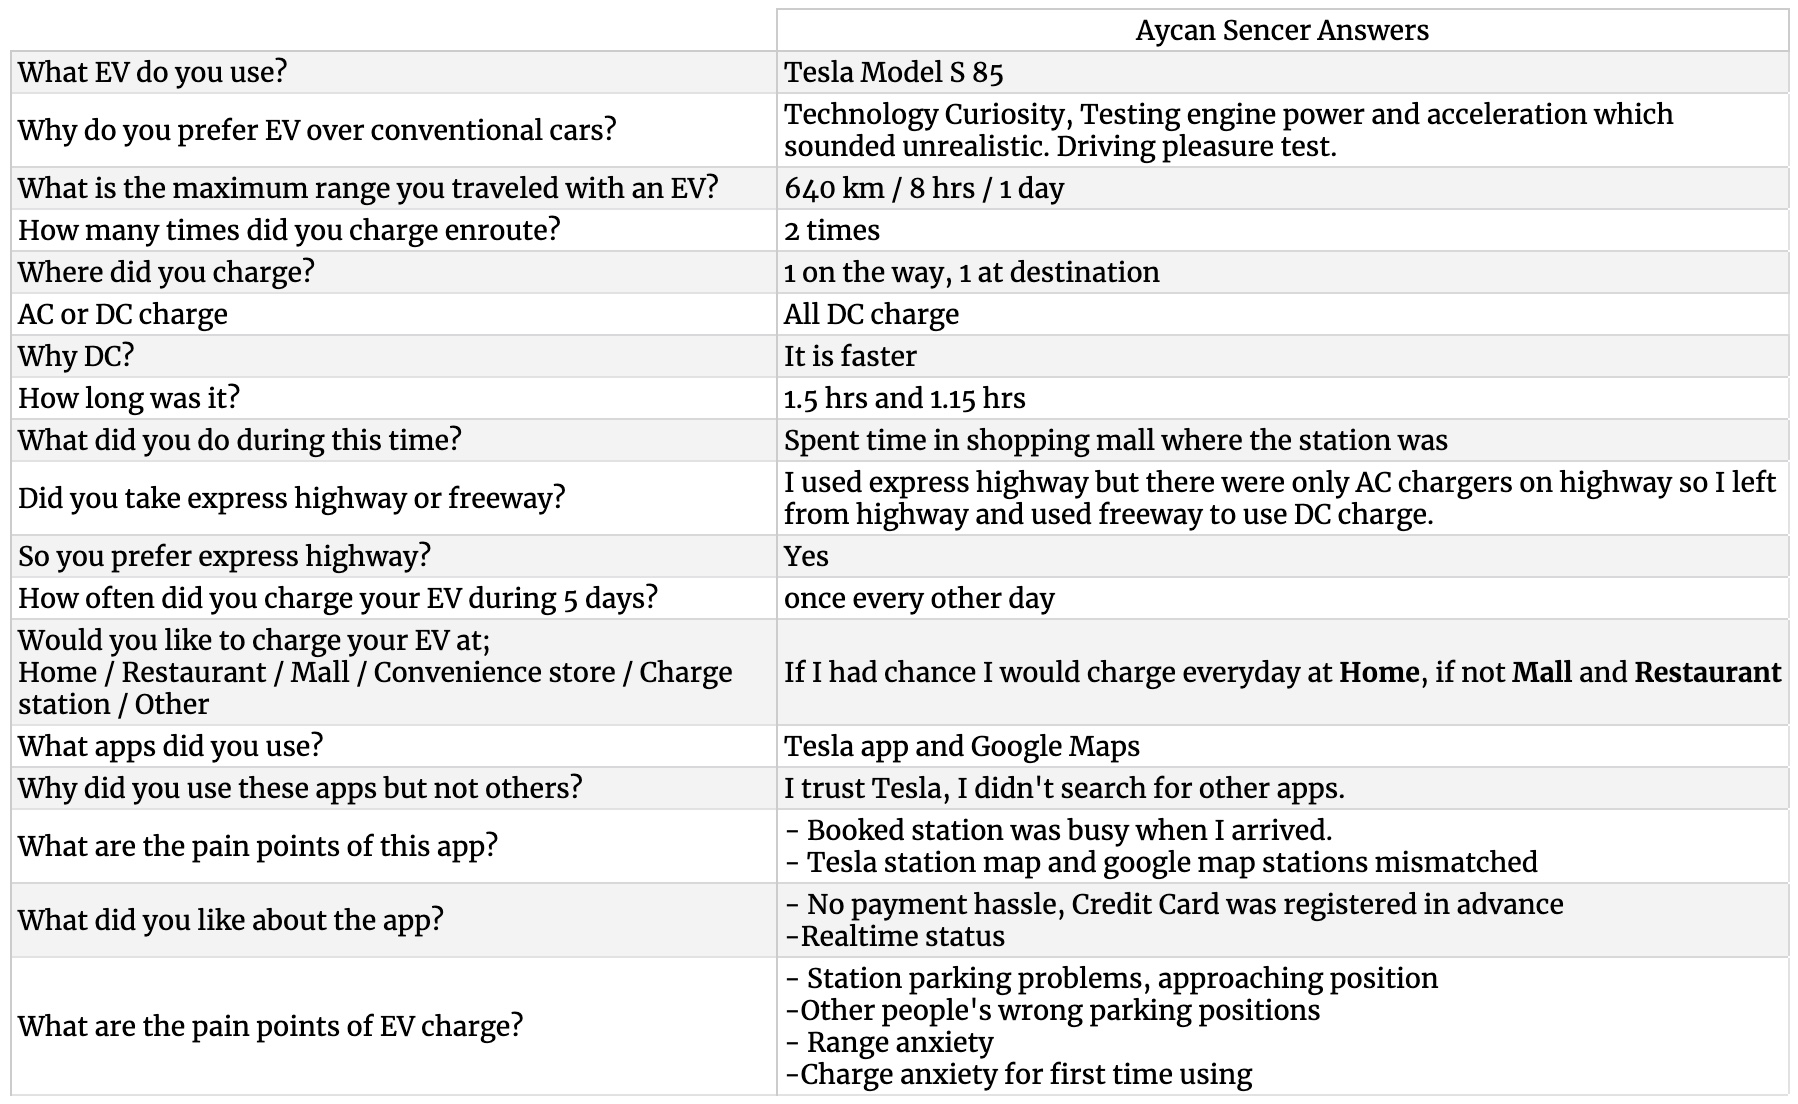
Qualitative Research
EV users are interviewed.
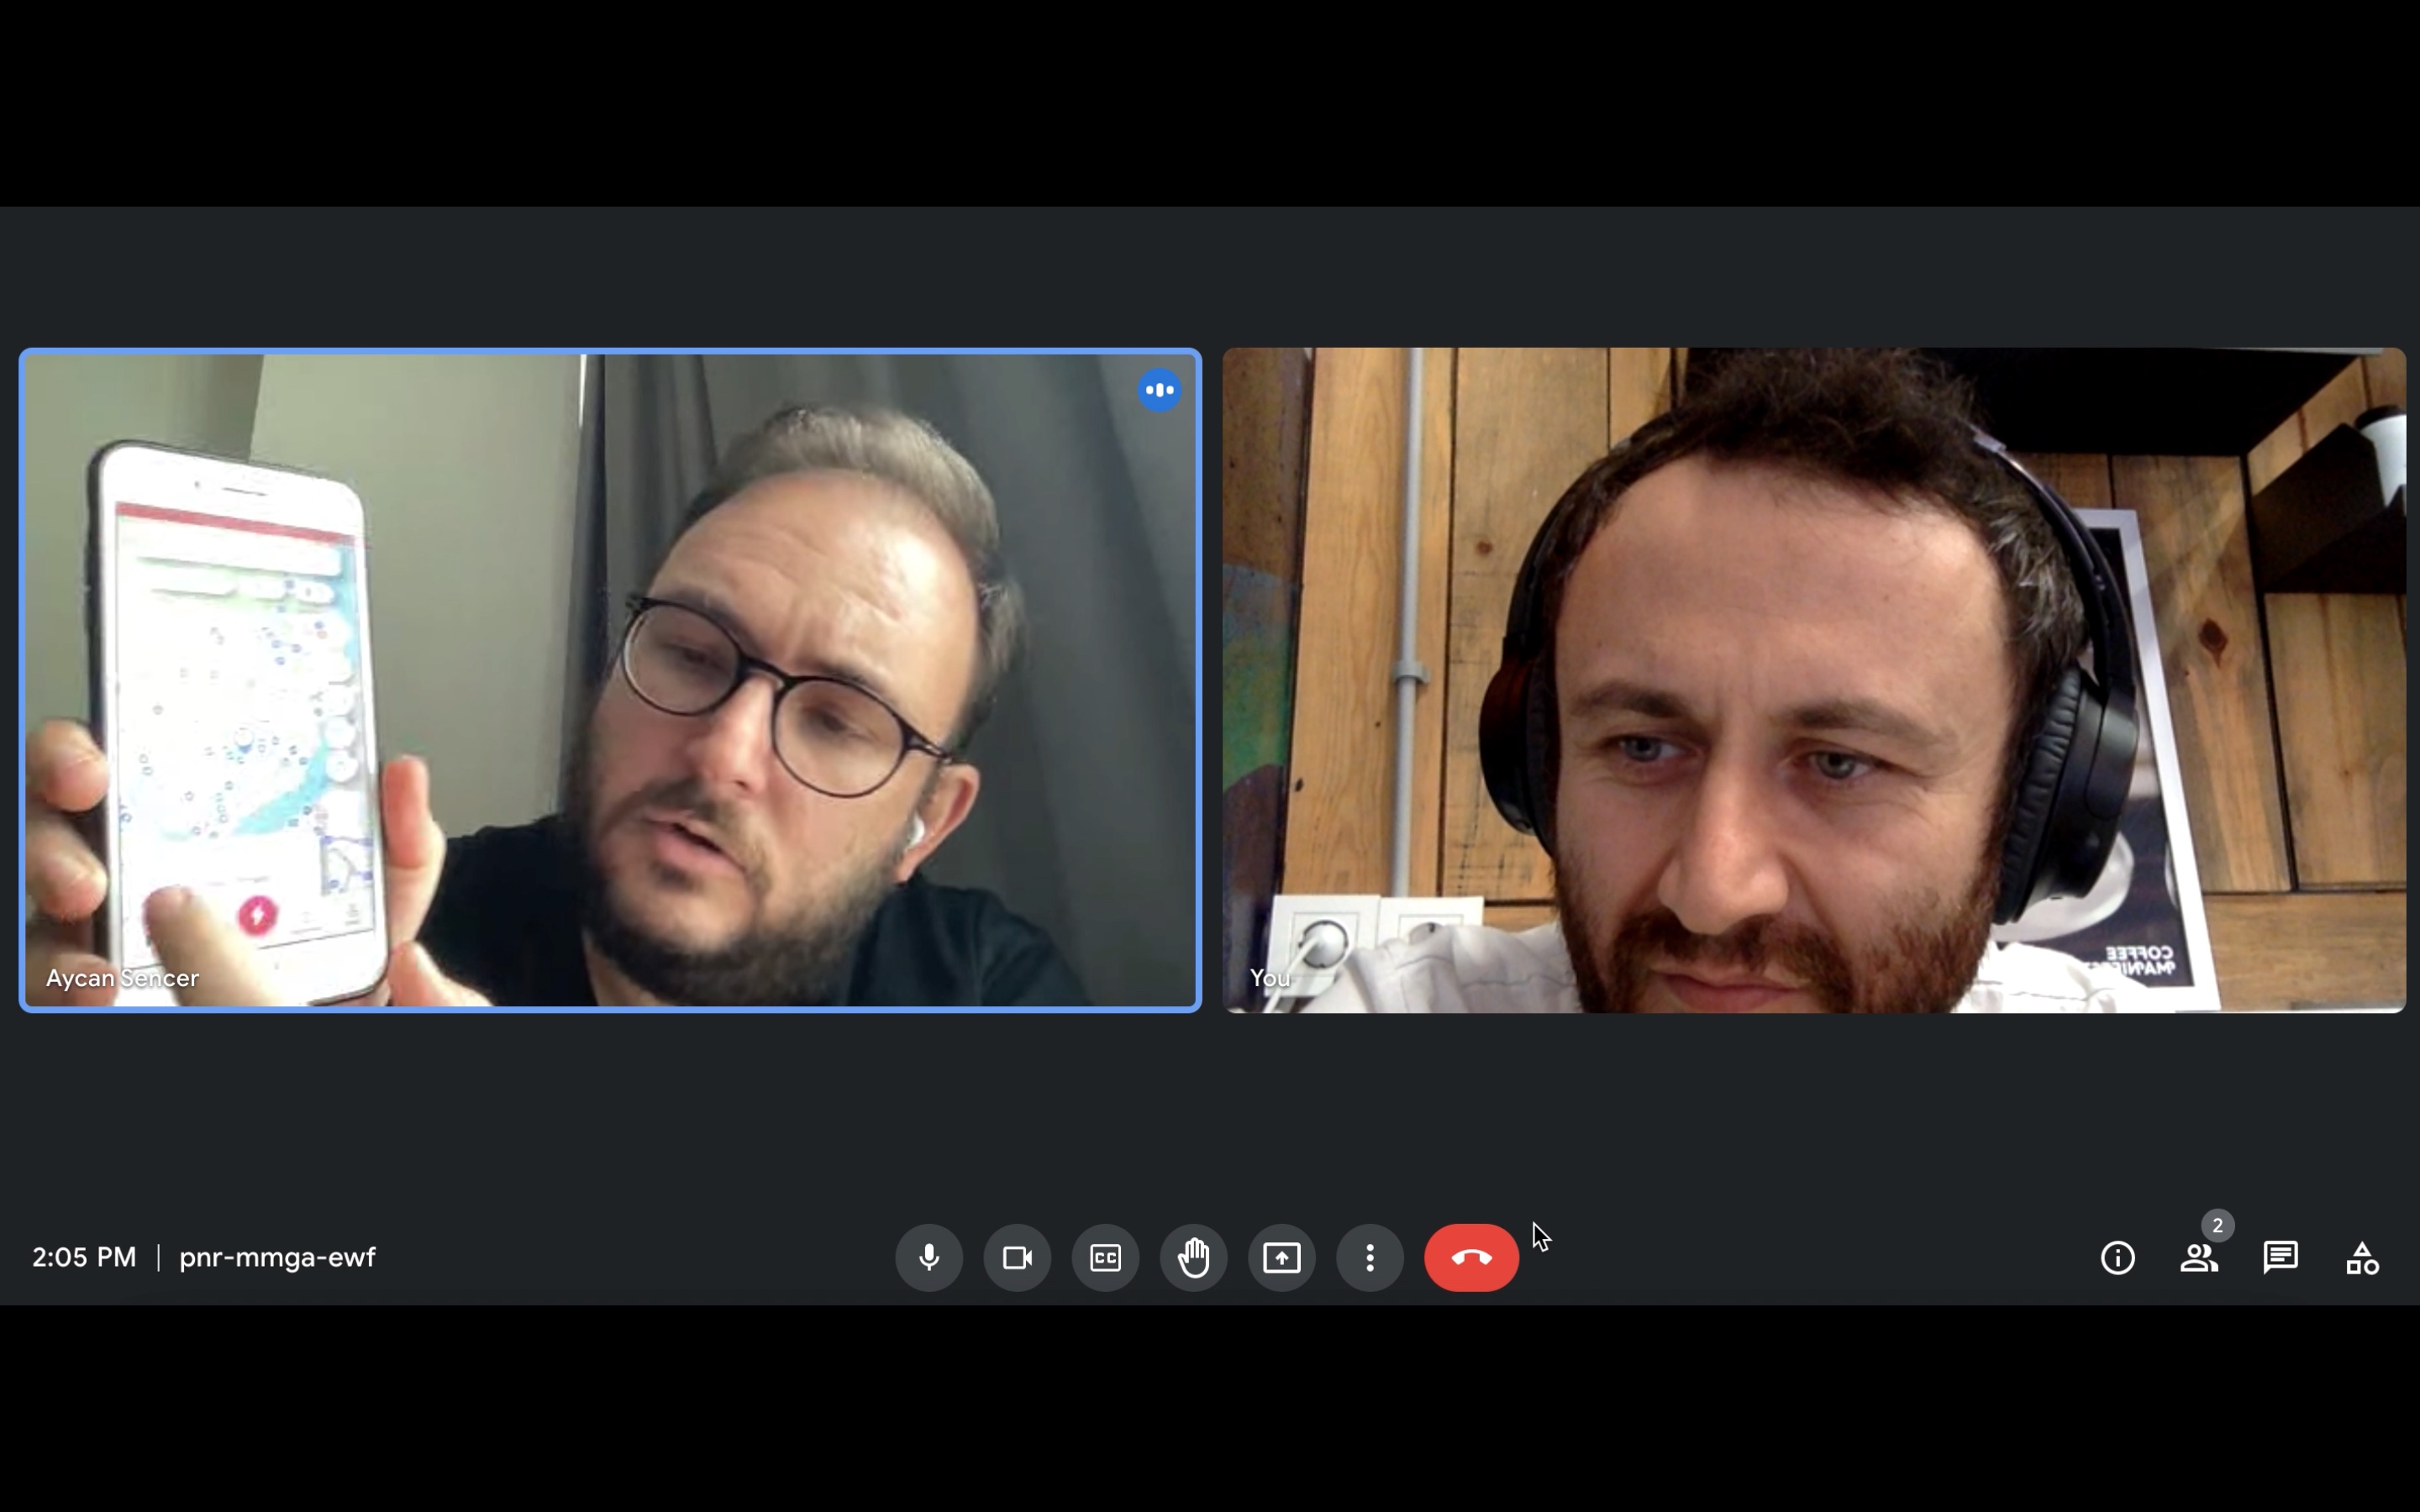
Some of the semi-structured interview questions and answers.
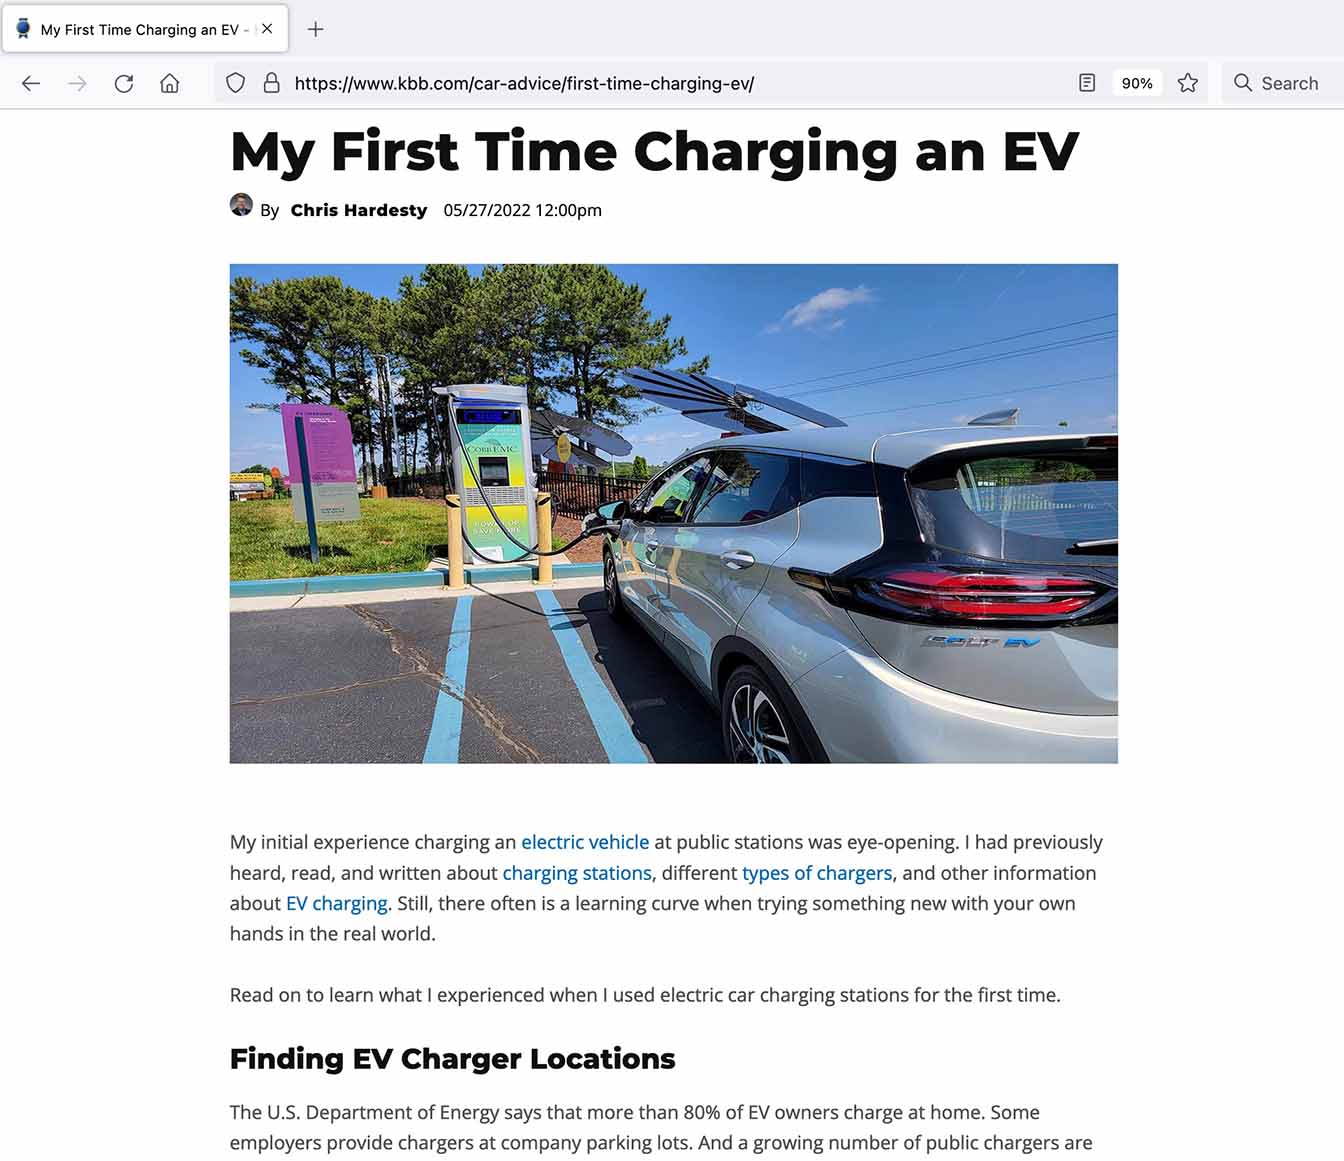
Read user reviews from the blogs.
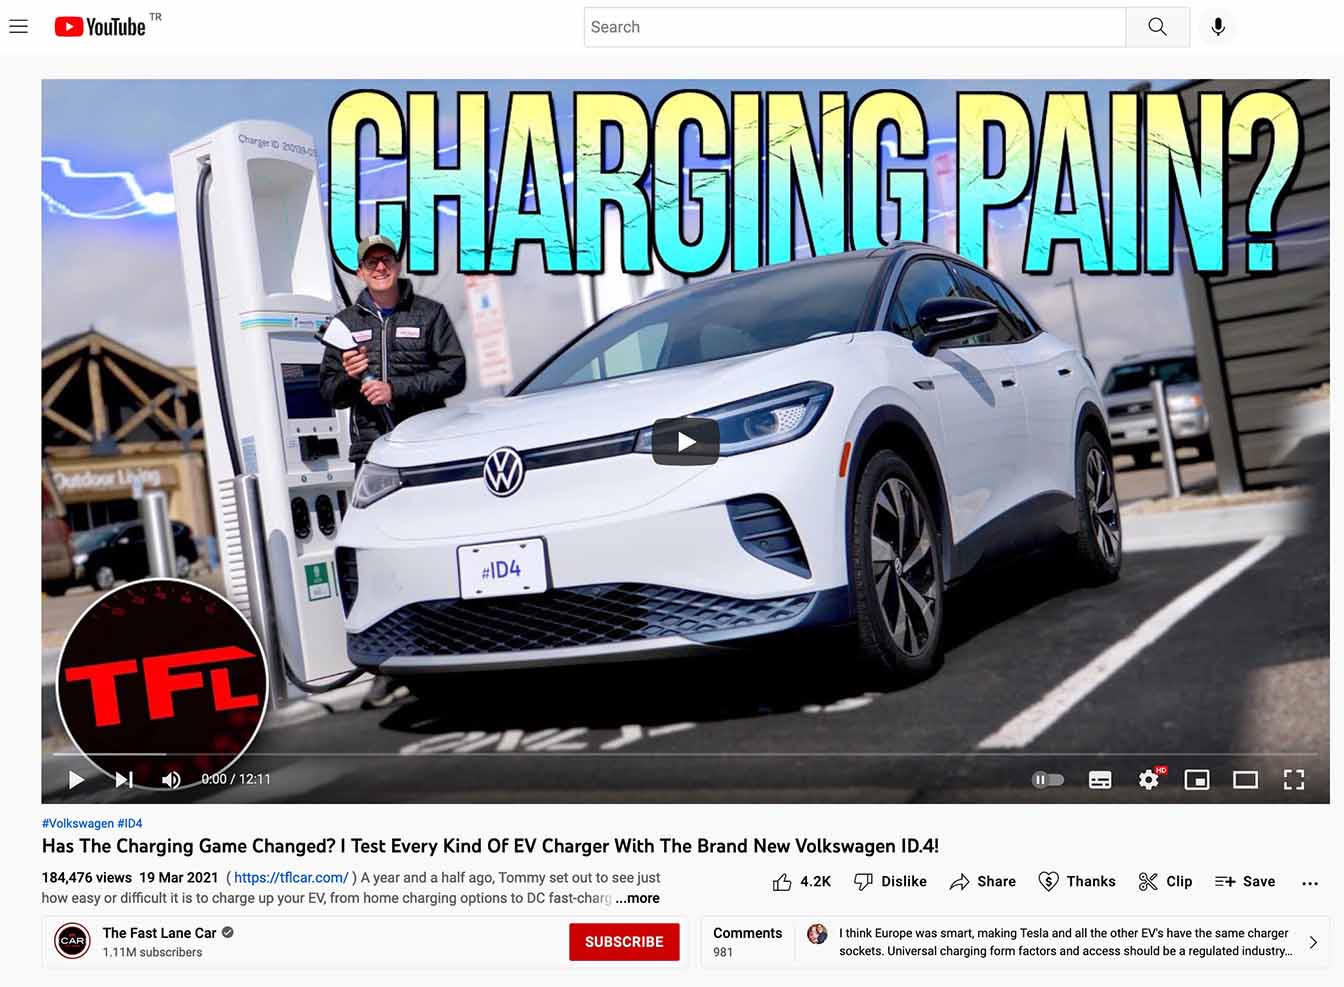
Watched vlogs regarding EV charging experience.
Read user reviews of current experiences from the App store.

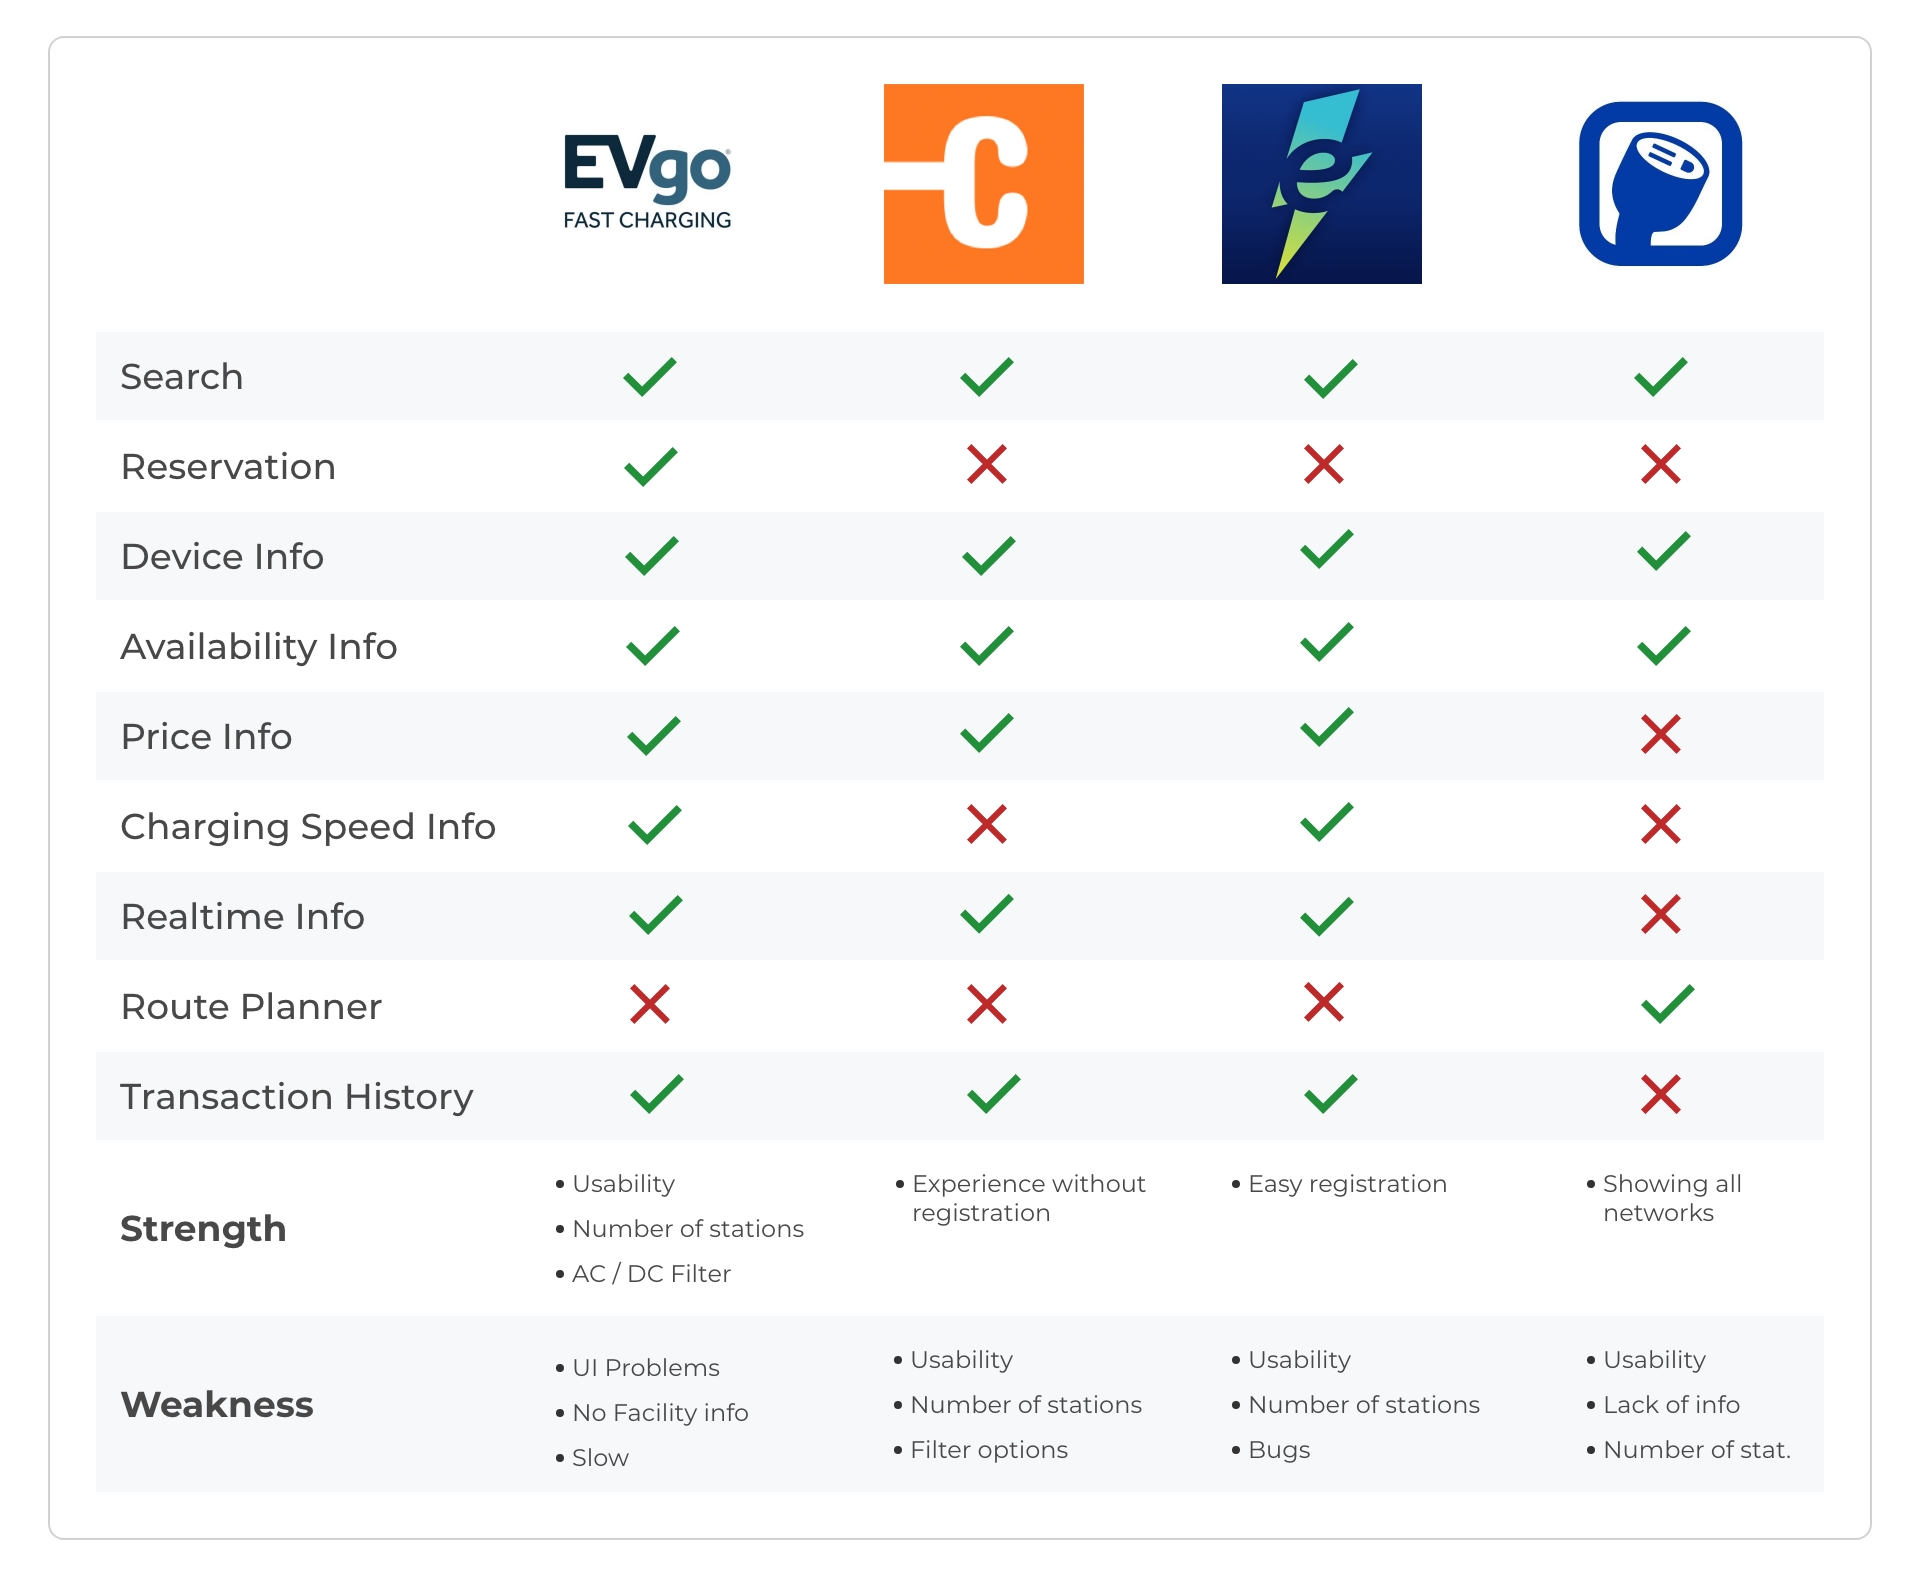
Competitive Analysis
Analyzed four different companies' EV charging experience.
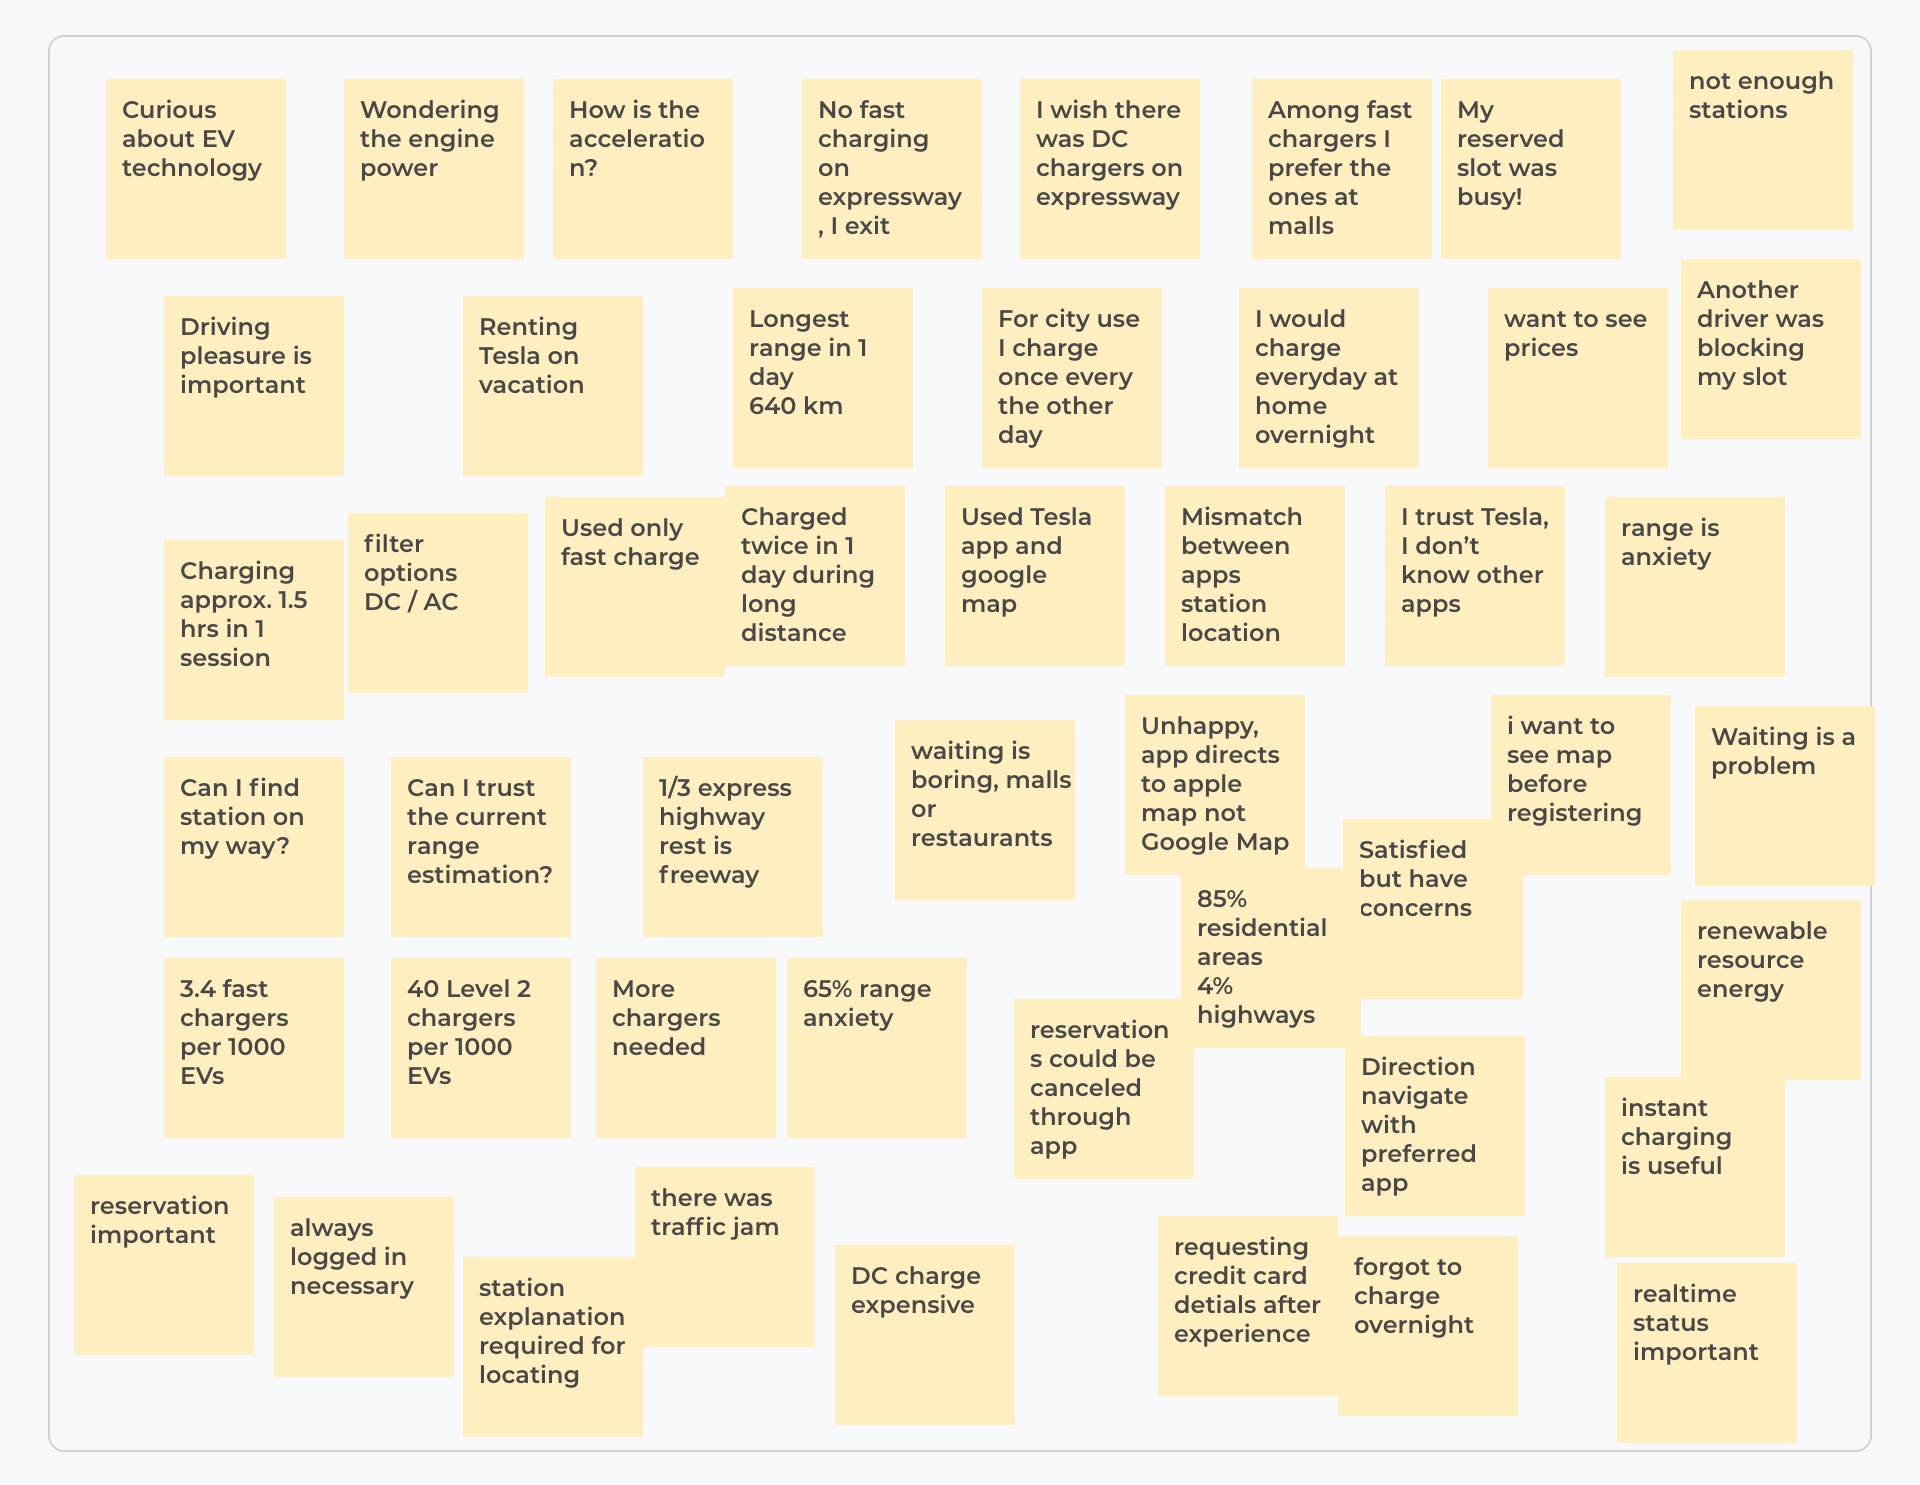
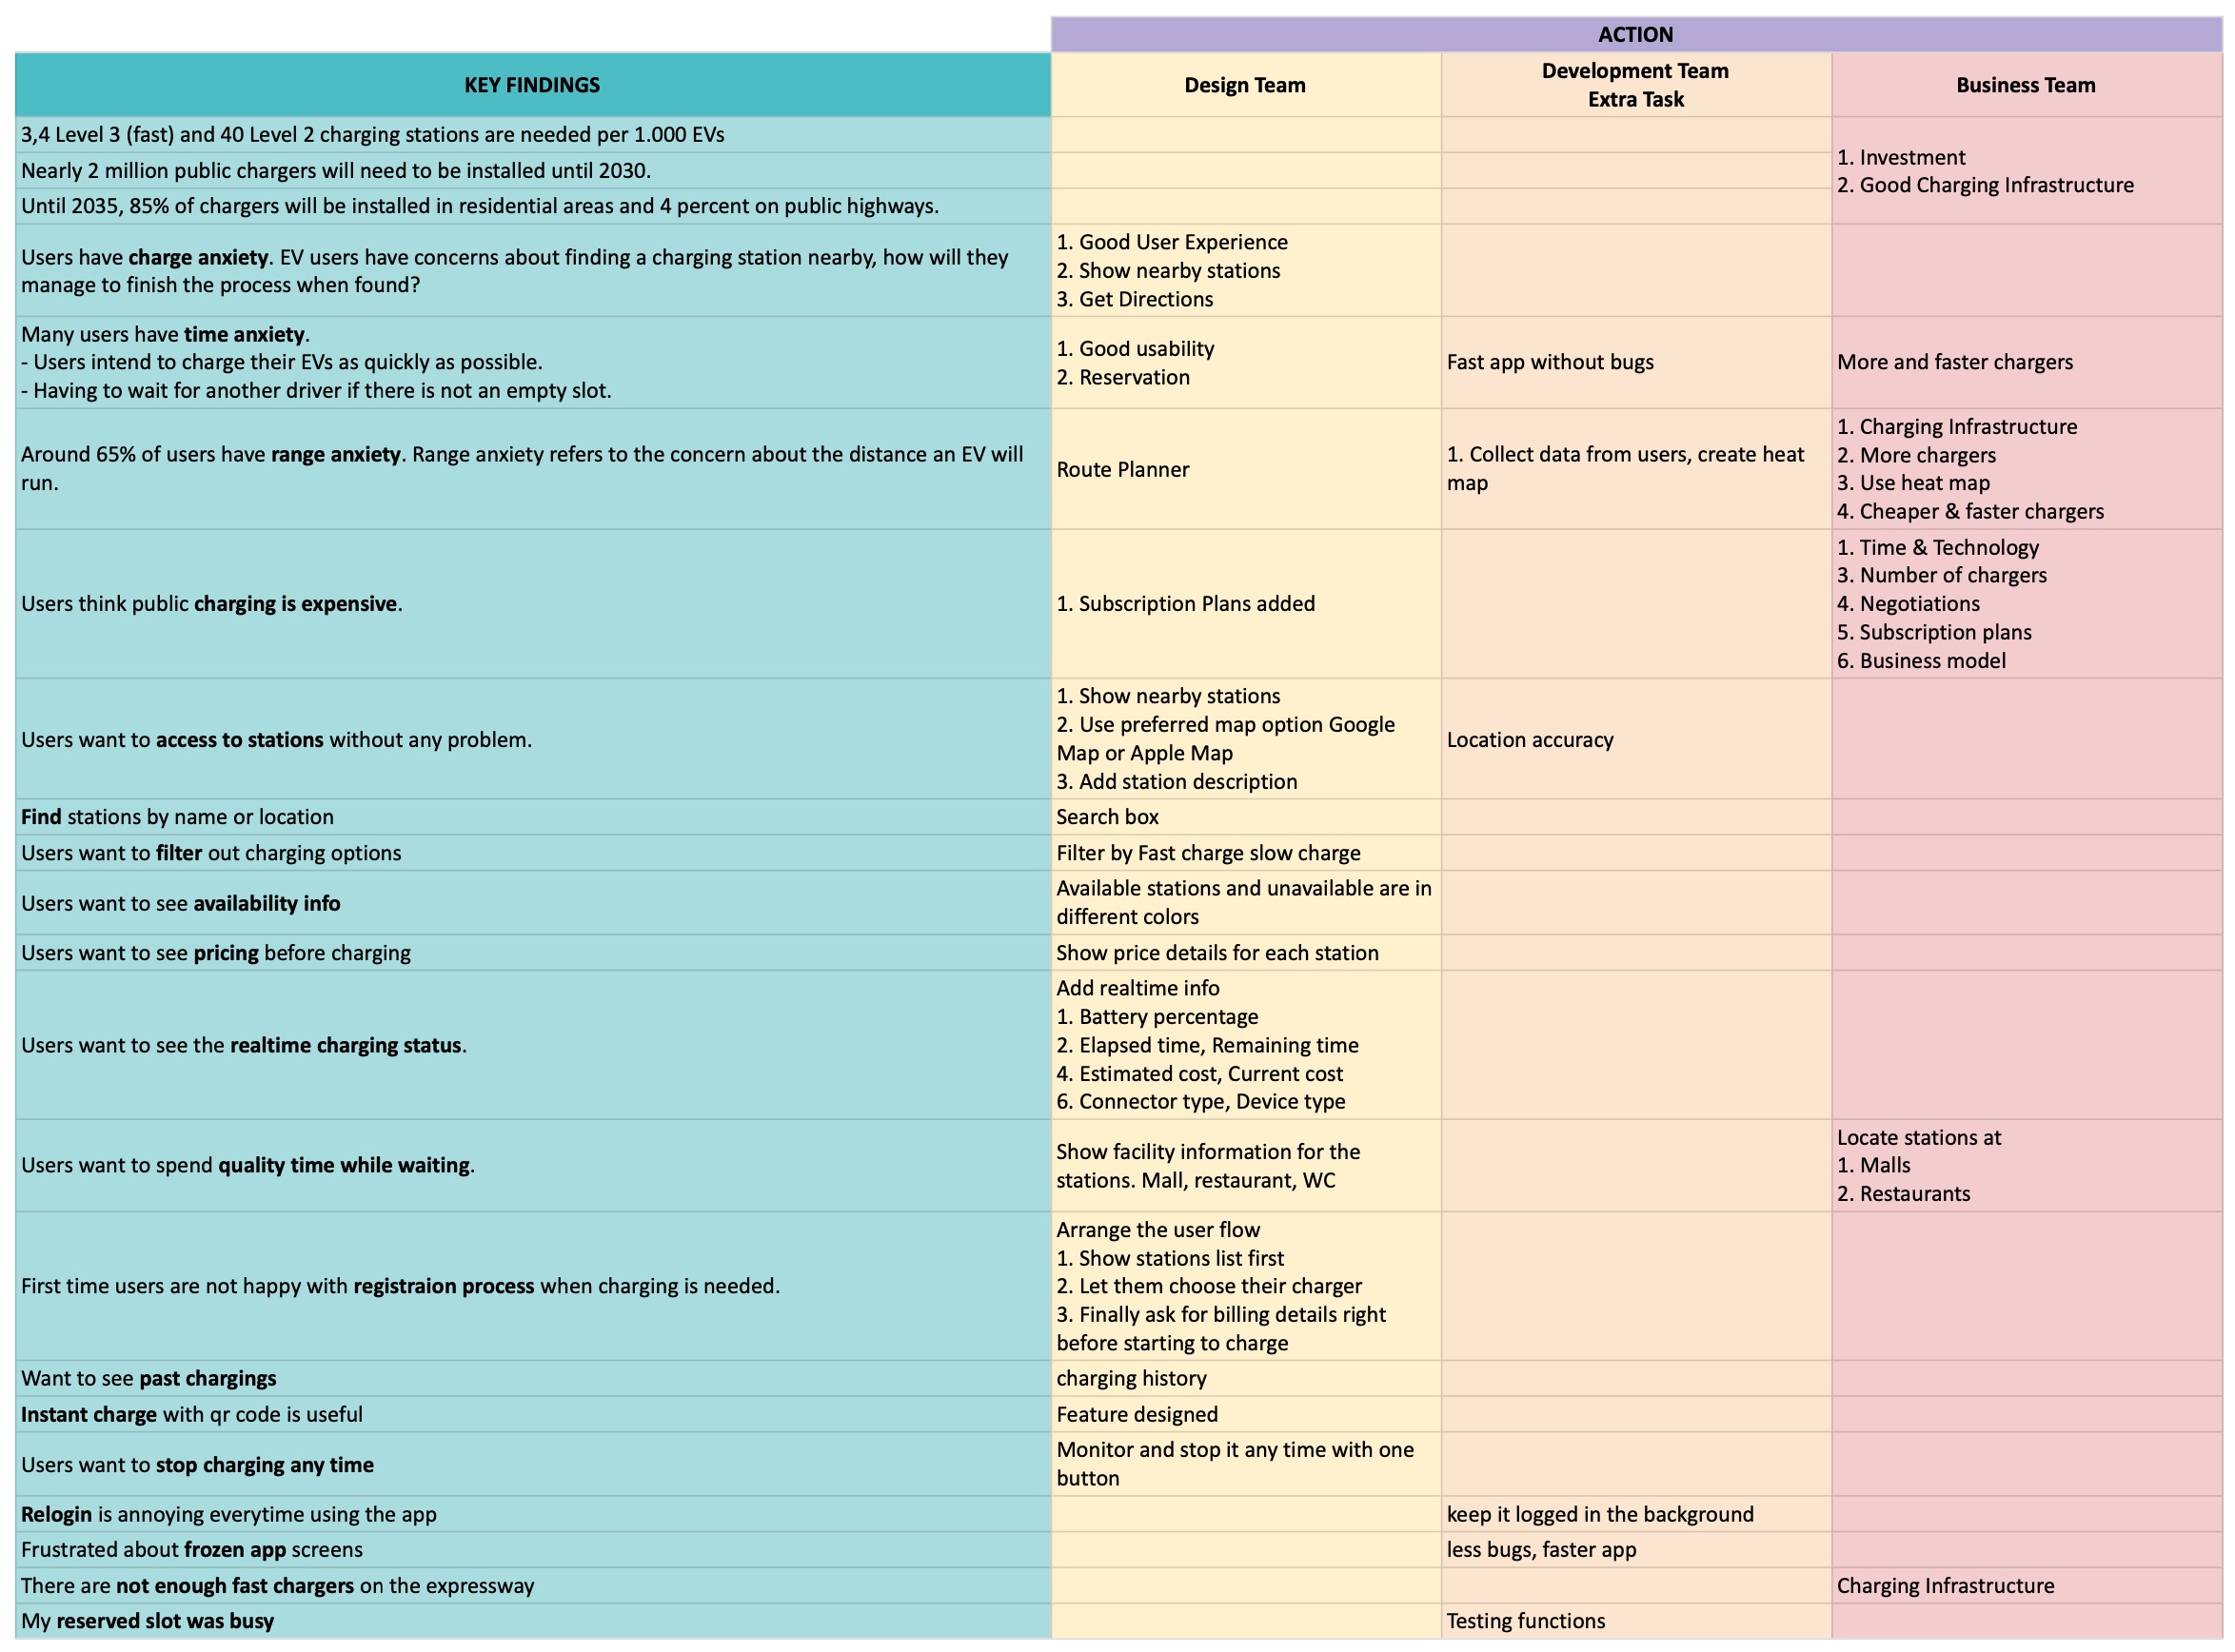
Key Insights
I gathered useful information from the process. Here are some key findings.
- Around 65% of users have range anxiety. Range anxiety refers to the concern about the distance an EV will run.
- Users have time anxiety.
- Users intend to charge their EVs as quickly as possible.
- Having to wait for another driver if there is not an empty slot.
- Users have charge anxiety.
- EV users have concerns about finding a charging station nearby.
- When they find it, how will they manage to finish the process?
- 3,4 Level 3 and 40 Level 2 charging stations are needed per 1.000 EVs
- Nearly 2 million public chargers will need to be installed until 2030.
- Until 2035, 85% of chargers will be installed in residential areas and 4 percent on public highways.
- Users prefer fast (DC) public chargers but they are expensive.